What Are Agency Growth Metrics?
Agency growth metrics are the numbers that tell you whether your agency is getting healthier, not just busier: how predictable your revenue is, how much profit each client leaves, how efficiently your team turns hours into money, and how well you keep and win clients. Agency metrics are different from the campaign metrics you report to clients (clicks, impressions, rankings). Agency metrics run the business, not the ad account.
Most lists of agency KPIs stop at naming the metrics. This guide does the two things that actually let you use them: it gives the exact formula for each one, and a directional 2026 benchmark so you know whether your number is good, average, or a problem. Every benchmark below is labelled directional and attributed to its source, because agency data is thinner and noisier than SaaS data, and a made-up precise number is worse than an honest range.
Track four things, in this order
Revenue (is money coming in, and is it predictable?), profitability (how much of it do you keep?), efficiency (how well does your team turn paid hours into billable output?), and retention plus acquisition (do clients stay, and can you win new ones profitably?). If you only ever watched net profit margin, billable utilization, client churn, and pipeline win rate, you would already run a healthier agency than most.
The 12 Metrics Every Agency Should Track, at a Glance
Here is the full set with its formula and a healthy 2026 benchmark. Each one is explained in detail below, with the most common mistake and how to track it.
| Metric | Formula | Healthy 2026 benchmark (directional) |
|---|---|---|
| 1. Monthly Recurring Revenue (MRR) | Sum of active retainers, each normalized to a monthly fee | Recurring income 60%+ of total revenue |
| 2. Revenue Growth Rate (YoY) | (This period minus same period last year) / same period last year × 100 | 10-20% YoY (directional) |
| 3. Average Revenue Per Client (ARPC) | Net agency revenue / number of active clients | Varies by tier; SMB about $1-5k/mo |
| 4. Net Profit Margin | Net profit / net revenue × 100 | 10-20% (about 15% is the long-run norm) |
| 5. Delivery (Gross) Margin | (Agency gross income - delivery cost) / AGI × 100 | About 55% on the P&L, 70% per project |
| 6. Client Churn Rate (annual, logo) | Clients lost / clients at start × 100 | Keep 85-90% of clients a year |
| 7. Net Revenue Retention (NRR) | (Start + expansion - downgrades - churn) / start × 100 | Around 100%+ (directional) |
| 8. Billable Utilization Rate | Billable hours / available hours × 100 | 65-85% for delivery staff |
| 9. Effective Hourly Rate (realization) | Fees earned / all hours actually worked | About 2.5-3x labor cost; realize 85-90%+ |
| 10. Client Acquisition Cost (CAC) | Sales & marketing spend / new clients won | S&M about 7-14% of revenue |
| 11. LTV:CAC Ratio | Lifetime value / acquisition cost | 3:1 to 5:1; payback under 12 months |
| 12. Proposal / Sales Win Rate | Won / (won + lost) × 100 | 30-50% of qualified pitches |
A quick note on honesty before the detail: these benchmarks are directional targets drawn from agency-industry research (Promethean Research, Parakeeto, AgencyAnalytics, Predictable Profits, and others named per stat), not universal laws. Your own trend over time matters more than hitting an industry average, because agencies define and count these numbers inconsistently.
Revenue and Growth Metrics
These answer the first question any owner has: is money coming in, and can I count on it next month?
1. Monthly Recurring Revenue (MRR)
What it is: the predictable income you can count on every month from active retainers and recurring contracts, normalized to a monthly figure. Why it predicts growth: retainer income is committed before the month even starts, so it funds payroll and overhead without re-selling every month, and it lets you invest ahead of demand instead of lurching through feast-or-famine project cycles.
Formula: MRR = sum of active retainers, each normalized to a monthly fee (annual contract value / 12 for non-monthly terms). Recurring revenue share = trailing-12-month recurring revenue / trailing-12-month total revenue × 100.
Benchmark (directional): aim for recurring income to make up 60%+ of total revenue (60-70% is the commonly cited growth-stage band, the point where recurring covers most fixed costs). Retainers are now the primary model for about 78% of agencies (Digital Agency Network, 2026) and offered by roughly 91% (Promethean Research, 2025). On the recurring base itself, one SMB-focused benchmark puts best-in-class monthly gross churn under 2%, with 3-7% acceptable (GigRadar, 2026), so treat that as a single-vendor signal, not a law.
Common mistake: counting one-off project fees, scope overages, and pass-through ad spend as recurring revenue. Counting them as recurring inflates MRR and makes the book look stable while the true recurring base is quietly churning.
How to track it: tag every contract as recurring or one-off, sum the normalized monthly value of active retainers, and reconcile against the P&L so pass-through costs (ad spend, media, subcontractors) are stripped out. Trend it month over month and flag any retainer that ends or downgrades.
2. Revenue Growth Rate
What it is: the percentage change in revenue from one period to the next, tracked month over month for momentum and year over year for the real trend. Why it predicts growth: it is the most direct scoreboard for whether the agency is actually expanding, and steady year-over-year growth, rather than one lucky project, is what proves the engine compounds.
Formula: YoY growth = (this period revenue - same period last year) / same period last year × 100. Use last month for the month-over-month version.
Benchmark (directional): a healthy 10-20% year over year is a directional target, not a rule. Among 300+ seven- and eight-figure agencies, 74% grew and about 49% grew 25%+ (Predictable Profits, 2025), but that is an already-successful subset, not all agencies. The broader industry averaged about 7.5% in 2025, up from roughly 5% in 2024 (Promethean Research).
Common mistake: measuring growth on gross billings that include pass-through media and contractor costs. A single big paid-media client can make the top line look like it is soaring while your own fee income and margin are flat.
How to track it: pull recognized revenue by month from the P&L, split it into recurring, one-off, and pass-through, and compare a trailing-12-month figure to the same window a year earlier to strip out lumpy project timing.
3. Average Revenue Per Client (ARPC)
What it is: the average recurring revenue you earn from each active client over a period. Why it predicts growth: rising ARPC means you are expanding existing accounts and moving up-market, so revenue compounds without a matching rise in sales and onboarding overhead, and larger accounts are usually cheaper to service per dollar.
Formula: ARPC = net agency revenue in the period / number of active clients in that period.
Benchmark (directional): it varies widely by client tier. As a rough guide, SMB and local clients run about $1,000-5,000 per month, mid-market about $5,000-15,000, and enterprise about $15,000-50,000+ (GigRadar, 2026). Because ARPC averages across all clients, it usually lands below any single typical retainer figure.
Common mistake: measuring ARPC on gross billings that include pass-through ad spend, which massively overstates it for PPC and media shops and hides whether an account is actually worth keeping.
How to track it: sum active retainer values for net agency revenue, divide by the count of active clients, and segment the result by client tier and service line.
Profitability Metrics
Revenue is vanity, profit is sanity. Net margin and delivery margin tell you how much of the money you actually keep.
4. Net Profit Margin
What it is: the share of net revenue left as profit after every cost is paid (salaries, subcontractors, software, rent, and all overhead). Net revenue here means agency gross income: billings minus pass-through media and subcontractor costs. Why it predicts growth: net margin is the cash you actually keep to reinvest in hiring, tooling, and new business, so it directly funds growth. Below roughly 10% there is nothing left to reinvest; a steady 15%+ compounds.
Formula: Net profit / net revenue × 100.
Benchmark (directional): roughly 10-20% after tax, with about 15% as the long-run norm, and the leanest, most focused shops reaching 20-30%. Promethean Research put the average digital agency at 13% in 2025, down from 14% in 2024; small studios under 10 staff averaged about 19%, versus roughly 8% for agencies of 50+. Those margin benchmarks assume a market-rate owner salary is already booked.
Common mistake: calculating margin on gross billings that still include pass-through ad spend, and without first paying yourself a market-rate salary. Both mistakes inflate the number, so the reported margin is fiction and the agency thinks it is healthier than it is.
How to track it: strip pass-through costs to get true net revenue, subtract delivery labor (from time tracking), tooling, and overhead from the P&L, then roll the same calculation up by client to see which accounts drag the blended margin down.
5. Delivery (Gross) Margin per Project or Client
What it is: the share of the fee left after the direct cost of the people who actually delivered the work, measured against agency gross income, before overhead. Why it predicts growth: it is the single best early predictor of whether an agency can fund its own growth, because thin per-project margins mean every new client just adds work without adding money to reinvest.
Formula: Delivery margin % = (agency gross income - direct delivery cost) / agency gross income × 100, where AGI = revenue minus pass-through costs, and delivery cost = the fully loaded cost of the hours spent delivering.
Benchmark (directional): Parakeeto recommends roughly 55% at the P&L level and about 70% per project (with 50-60% and 70%+ as healthy ranges). In practice this is a stretch: recent surveys suggest only about a quarter of agencies clear the 50% line, and the median gross margin among established UK agencies (£1M+ turnover) has slipped to around 39% (The Wow Company BenchPress, 2024). Treat the UK figure as directional and not a like-for-like comparison.
Common mistake: measuring on the top-line fee instead of AGI, and never charging each project the real fully loaded cost of the hours delivered, so a big retainer looks healthy while over-servicing quietly erases the margin.
How to track it: tie every timesheet entry to a client or project, multiply logged hours by each person's fully loaded cost to get delivery cost, and compare that to the fee net of pass-through, shown per client and per project on a live view that updates as hours are logged.
Retention Metrics
It costs far more to win a client than to keep one, so a leaky base caps growth no matter how good your sales are.
6. Client Churn Rate
What it is: the percentage of clients (logo churn) or recurring revenue (revenue churn) you lose over a period. Why it predicts growth: churn sets the leak rate on your revenue base, so every new client first has to backfill a lost one before the agency actually grows. Cutting churn a few points compounds into far more retained revenue than the same effort spent on new sales.
Formula: Logo churn = clients lost / clients at start × 100. Gross revenue churn = recurring revenue lost / recurring revenue at start × 100.
Benchmark (directional): retainer agencies average roughly 15-20% annual logo churn (about 1.6% a month), with top performers holding it to 8-10%; project-based shops run far higher at 40%+. A healthy target is keeping 85-90% of clients a year (Focus Digital, 2026, supported by Parakeeto). Churn varies sharply by service line, with PPC churning much higher than full-service.
Common mistake: tracking only logo churn and ignoring revenue churn, so losing one $10k-a-month anchor account looks the same as losing three small ones, or even flatters the number.
How to track it: compare active retainers at the start and end of each month, flag cancellations, pauses, and downgrades, and watch early-warning signals already in your system: falling logged hours against a retainer, slipping approvals, and invoices going overdue, so at-risk accounts surface before they cancel.
7. Net Revenue Retention (NRR)
What it is: how much recurring revenue you keep and grow from the clients you already had at the start of a period, after upsells, downgrades, and losses, without counting any new clients. Why it predicts growth: above 100% means your existing book grows on its own before you win a single new client, so revenue compounds instead of leaking, and expanding a client you already serve is far cheaper than acquiring a new one.
Formula: NRR = (starting recurring revenue + expansion - downgrades - churn) / starting recurring revenue × 100, on the same client cohort, excluding any client won during the period.
Benchmark (directional): retainer-led agencies that upsell actively can run around 100% or a bit above (roughly up to 110-115%), while project-heavy or high-churn shops often sit below 100%. Hard NRR norms are SaaS-native, and the agency figure here rests on a single low-authority source (GigRadar, 2026), so treat it as directional only.
Common mistake: tracking how many clients you kept (logo retention) instead of how much revenue the existing base retained and grew. Counting logos rather than revenue hides silent scope-shrink: a client who renews but cuts their retainer looks retained while the account is actually contracting.
How to track it: anchor to the recurring revenue of a start-of-period client cohort, track those same accounts forward tagging upsells, downgrades, and churn, and keep the sales pipeline separate so new-logo revenue never contaminates the number.
Efficiency and Capacity Metrics
Utilization and effective hourly rate are where agencies quietly win or lose their margin: how much of the team you are paying for actually turns into billable output, and at what real rate.
8. Billable Utilization Rate
What it is: the share of a person's available working hours that goes to billable client work. Why it predicts growth: it is the lever between headcount and revenue. Every point you recover turns already-paid capacity into billable output without new hires. Parakeeto notes that a roughly 10-point utilization gain on the same team can add about six figures of annual profit.
Formula: Billable hours / available hours × 100, where available hours are scheduled work hours after subtracting holidays, PTO, and sick time.
Benchmark (directional): delivery and production staff (designers, developers, writers) run about 65-85% on an annualized basis, or 75-90% in a strong week. Whole-agency net utilization, counting non-delivery roles, typically runs 50-60% (one 2019 study put the average near 53%, Summit CPA). Sustained readings above roughly 80-85% signal understaffing or burnout, not a win.
Common mistake: treating utilization as a number to maximize and pushing delivery staff toward 90-100%, which leaves no room for business development, training, or absences, and drives turnover. A close second is dividing by all paid hours instead of true available hours.
How to track it: set a target available-hours capacity per role, have time tracking tag every entry as billable or internal, and report utilization per person and by delivery versus non-delivery role, not as one blended agency average.
9. Effective Hourly Rate (Realization)
What it is: the actual revenue you keep per hour actually worked on an engagement, and realization is that figure expressed against the rate you quoted, so it shows how much of your intended price survived scope creep and over-servicing. Why it predicts growth: the realization gap is the earliest signal that pricing or scope is leaking margin, so closing it lifts profit with the clients you already have.
Formula: Effective hourly rate = fees earned on the work / all hours actually worked on it. Rate realization = effective rate / quoted rate × 100.
Benchmark (directional): North American agency effective rates commonly land around $150-175 an hour, but the spread is enormous ($25 to $2,500+ depending on discipline and seniority), so treat the mid-figure as a loose reference. Keep the effective rate at roughly 2.5-3x fully loaded labor cost (a 60-70%+ delivery margin), and hold realization around 85-90% or higher (Parakeeto, plus professional-services norms).
Common mistake: dividing revenue by only billable or invoiced hours instead of every hour actually worked. Leaving out revisions, coordination, and over-servicing inflates the rate and hides the real gap, so you think a client is profitable when it is quietly losing money per hour.
How to track it: divide fees per client by all hours logged against that engagement, both billable and non-billable, compare to the rate you quoted, and flag any retainer where the effective rate drops below about 2.5x labor cost or realization falls under about 85%.
Acquisition Metrics
Growth needs new business too. CAC, lifetime value and win rate tell you whether winning clients pays for itself.
10. Client Acquisition Cost (CAC)
What it is: the total sales and marketing money you spend to win one new client. Why it predicts growth: CAC tells you whether new business pays for itself, and paired with lifetime value it sets your LTV:CAC ratio, which caps how fast you can afford to grow.
Formula: CAC = total sales and marketing spend in a period / new clients won in that period.
Benchmark (directional): agencies typically invest roughly 7-14% of revenue (or adjusted gross income) in sales and marketing (about 7% on average, 10-15% for above-average growth, per Promethean Research; 8-14% of AGI, per Parakeeto). A healthy target is an LTV:CAC ratio of at least 3:1. Absolute dollar CAC varies so widely with deal size that any single figure is an illustration, not a benchmark.
Common mistake: counting only external ad and media spend and leaving out the fully loaded cost of business-development people, owner selling time, commissions, and unpaid pitch and proposal hours. Leaving those costs out understates true CAC by half or more.
How to track it: sum every sales and marketing cost from the P&L, add the labor share of selling time from time tracking, and divide by closed-won deals from the pipeline over the same window; segment CAC by channel to see what actually works.
11. Client Lifetime Value (LTV) and LTV:CAC Ratio
What it is: the total gross profit a single client produces over the whole time they stay with you, and the ratio of that to the fully loaded cost of winning them. Why it predicts growth: it tells you whether each dollar spent winning a client comes back several times, so you know how hard you can push acquisition without eroding margin.
Formula: LTV = average monthly retainer × gross margin % × average client lifespan in months. LTV:CAC = LTV / CAC.
Benchmark (directional): a healthy LTV:CAC is generally cited at 3:1 to 5:1, with CAC payback under 12 months (under 6 is excellent), but that is a cross-industry services convention, not agency-specific data. The LTV side depends on your own numbers: agency gross margins commonly run about 50-65%, and client tenure varies widely (roughly 2 years for project work up to 4-5 for retainers), so use your actual tenure rather than an average.
Common mistake: understating CAC by counting only ad spend and leaving out selling time, pitch labor, and referral fees. Loading those in can turn an apparent 3:1 ratio into a real 1.5:1 and double the payback period.
How to track it: pull each client's average retainer and gross margin from the P&L, multiply by realized tenure from contract dates for LTV, build true CAC with loaded selling and pitch hours, and track the payback in months.
12. Proposal and Sales Win Rate
What it is: the share of the proposals or pitches you send to qualified prospects that convert into signed clients. Why it predicts growth: it is a direct multiplier on revenue that needs no extra pipeline, because every point you add converts existing opportunities into fee income and shortens the payback on business-development time.
Formula: Win rate % = proposals won / (proposals won + lost) × 100.
Benchmark (directional): for proposals actively pitched to qualified prospects, agencies commonly win about 30-50%, with roughly 40% a healthy target and top performers above 50%. In the AgencyAnalytics 2025 Marketing Agency Benchmarks Report (220+ agency leaders), 34% of agencies convert 31-50% of the pitches they deliver, and about a quarter convert under 25%. Because agencies count proposals sent inconsistently, weigh your own trend over the benchmark.
Common mistake: calculating win rate against every proposal sent, including to poorly qualified leads you never had a real shot at. Counting every proposal sent hides whether the real problem is lead quality or pitch quality, and pushes teams to write more proposals rather than better-qualified ones.
How to track it: stamp each pipeline opportunity with a proposal-sent date and a final outcome (won, lost, or no-decision), compute won divided by won plus lost over a trailing window, and segment by lead source, service line, and deal size.
How the Metrics Connect (the Part Most Lists Skip)
The value is not in the individual tiles, it is in the links between them. Read as a chain, the efficiency metrics build into the profit metrics: your utilization (how much of your paid capacity earns) times your effective hourly rate (what each of those hours actually captures) produces your delivery margin, and delivery margin minus overhead produces your net margin. Move one link and you move the chain. Recovering 10 points of utilization, or closing a realization gap on two accounts, lifts delivery margin without winning a single new client.
On the revenue side, MRR times retention (low churn, NRR above 100%) is what makes growth compound, and ARPC times win rate is how new business adds to it. A dashboard is only useful when you can read those relationships, not just the numbers in isolation.
The one equation to internalize
Utilization × effective rate → delivery margin → (minus overhead) → net margin. Almost every profitability problem in an agency is a leak in one of those three links: too little billable time, too low a real rate per hour, or too much overhead. Fixing the leak is nearly always cheaper and faster than selling your way out of it.
The Cash-Flow Metrics Agencies Forget
Profit on paper does not pay salaries, cash does. Two numbers rarely appear on agency KPI lists yet quietly kill otherwise profitable shops:
- Days sales outstanding (DSO): the average number of days from invoicing to getting paid. The lower the better. Creeping DSO means you are financing your clients out of your own bank account.
- Overdue invoice ratio: the value of overdue invoices divided by total outstanding. A rising ratio is an early warning long before it shows up as a cash-flow crunch.
Days sales outstanding and the overdue invoice ratio both come straight from your invoicing and payments records, and both improve fast when you tighten payment terms and make it easy for clients to pay on time.
How Often to Review Each Metric
A dashboard you check once a quarter is a report. A dashboard you act on is a cadence. A simple rhythm that works for most agencies:
- Weekly: billable utilization, pipeline and win rate, and overdue invoices. Capacity and cash move fast, so you want to catch problems inside the week.
- Monthly: revenue and growth, net and delivery margin, churn, MRR, and ARPC. These are your core scorecard.
- Quarterly: revenue per employee, LTV:CAC, and the structural view of where the business is heading.
Pair every number with a one-line note on what changed and what you are doing about it. A metric with no owner and no note is decoration.
Vanity Metrics Versus KPIs
A metric is any number you can measure. A KPI is a number tied to a decision. Impressions, follower counts, and raw hours logged feel productive, but they rarely change what you do next. The test is simple: if this number moved, would you do anything differently? If not, it is a vanity metric, and it is stealing attention from the ones that actually run the agency.
How to Track All of This in One Place
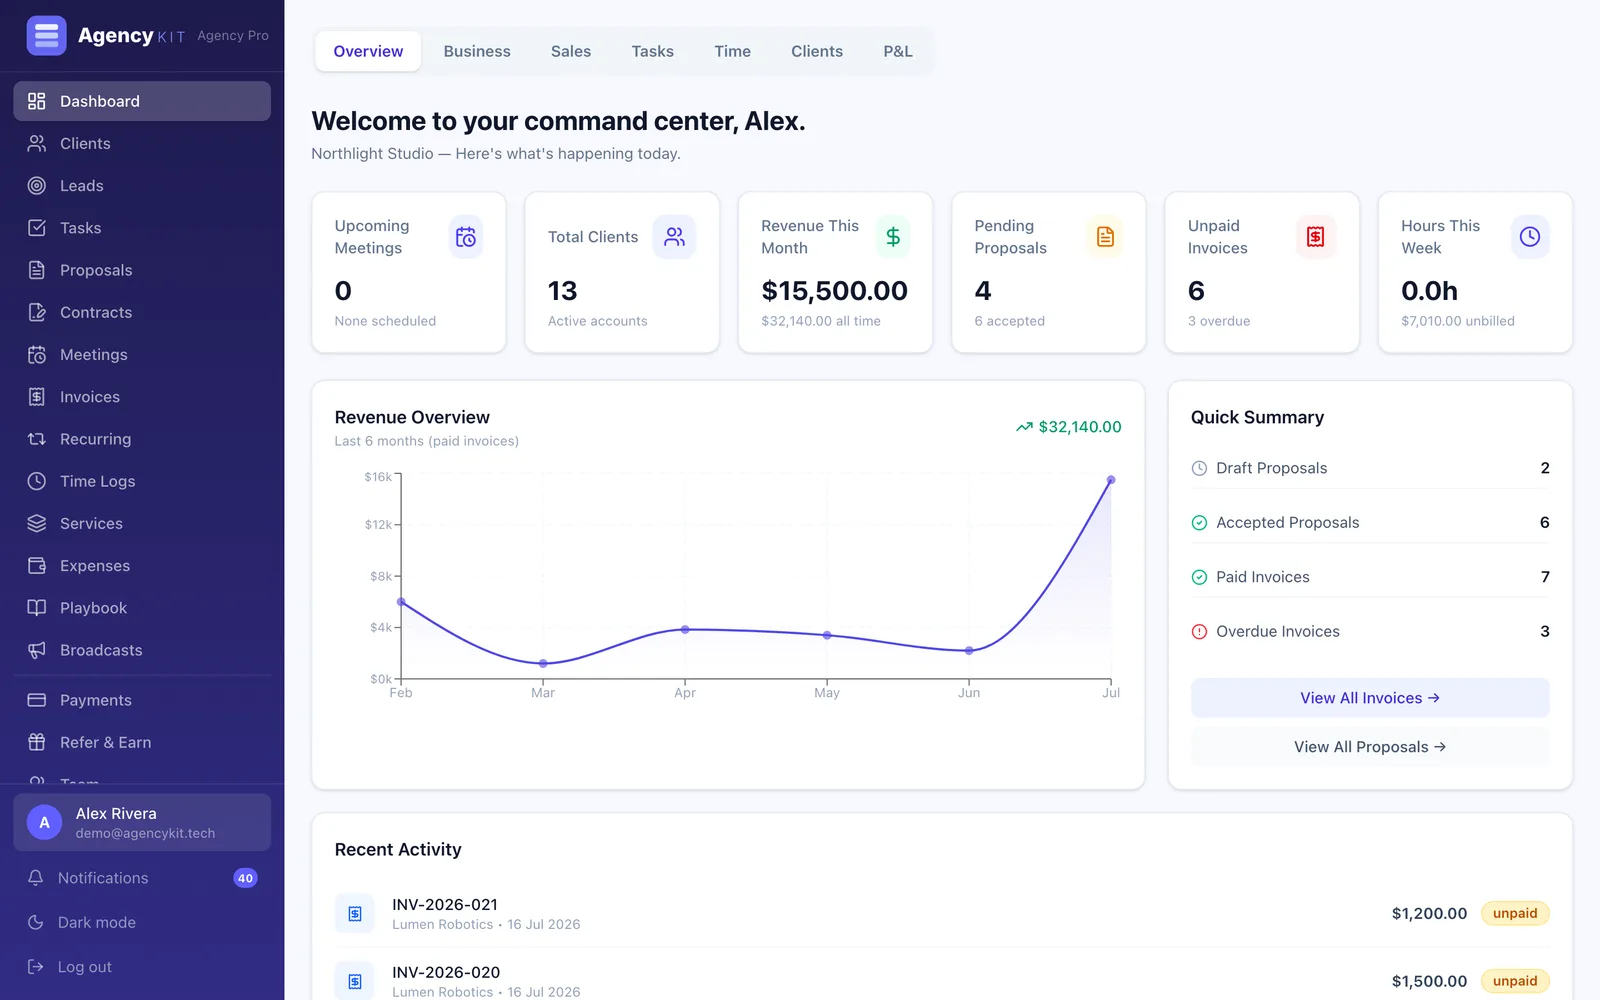
AgencyKit works out ten of these twelve metrics, and does not work out two. Ten of the twelve on this page are live figures in the reports and P&L: monthly recurring revenue, revenue growth, average revenue per client, net margin, billable utilization, effective hourly rate, CAC, LTV, LTV to CAC, and proposal win rate. Two are not. Client churn and net revenue retention are not calculated anywhere in the product, so if you need those you will still work them out yourself from the client list. The profit and loss report is on the Agency plan at $39 a month; everything the figures are built from, the tracked hours, the invoices, the retainers and the pipeline, starts on Starter at $9.
See these numbers on your own data 14 days free · no card required · cancel anytime
The real reason most agencies do not track these metrics is not laziness, it is that the data lives in eight different tools: proposals in one app, contracts in another, invoices in accounting, hours in a timer, and the pipeline in a spreadsheet. Every metric above needs two or three of those to talk to each other, and they do not.
AgencyKit keeps proposals, contracts, retainers, invoicing, payments, time tracking, and the sales pipeline in one workspace, so the numbers reconcile by default. Utilization comes from the same timesheets that feed your invoices, MRR and margin come from the same retainers and P&L, and win rate comes from the same pipeline that becomes your contracts. That is what turns these formulas from a monthly spreadsheet chore into a live dashboard. To see where you stand right now, run your own numbers through our free agency profitability calculator. For anyone comparing options, our guide to affordable agency management software and the AgencyKit for agencies overview are good next reads.
Key Takeaways
The short version
Track four groups: revenue (MRR, growth, ARPC), profitability (net margin, delivery margin), retention (churn, NRR), and efficiency plus acquisition (utilization, effective rate, CAC, LTV:CAC, win rate). Learn the chain utilization × effective rate → delivery margin → net margin, watch cash-flow (DSO and overdue invoices), review weekly and monthly, and treat any number that would not change a decision as a vanity metric.
Related Guides
Go deeper on the numbers behind these metrics: how to calculate your billable hourly rate, what a retainer agreement is, and how to turn time tracking into invoices. For a plain-English definition of every term used here, see the agency glossary.
Key Takeaways
- Track four groups: revenue (MRR, growth, ARPC), profitability (net and delivery margin), retention (churn, NRR), and efficiency plus acquisition (utilization, effective rate, CAC, LTV:CAC, win rate)
- Learn each metric’s formula and a directional 2026 benchmark, but weigh your own trend over any industry average
- The core chain is utilization × effective rate → delivery margin → net margin; most profit problems are a leak in one link
- Do not forget cash-flow metrics (days sales outstanding and overdue invoice ratio), which kill profitable-looking agencies
- Review capacity and cash weekly, your core scorecard monthly, and structural metrics quarterly, with a note on every number
- Measure on net revenue, not gross billings, and ignore vanity metrics that would not change a decision
Frequently Asked Questions
Track a balanced mix across four areas: profitability (net margin, delivery margin), growth (monthly recurring revenue, revenue growth rate, average revenue per client), retention (client churn, net revenue retention), and efficiency plus acquisition (billable utilization, effective hourly rate, CAC, LTV:CAC, and proposal win rate). Prioritize numbers tied directly to revenue and profit over vanity metrics like impressions or followers.
A healthy net profit margin runs about 10-20%, with roughly 15% as the long-run norm and the leanest shops reaching 20-30%. The average digital agency was around 13% in 2025 (Promethean Research). Small studios under 10 staff average closer to 19%, while agencies of 50+ average nearer 8%. Calculate it as net profit divided by net revenue, after booking a market-rate owner salary.
Utilization rate = billable hours divided by available hours, times 100, where available hours are scheduled hours after holidays, PTO, and sick time. If someone logs 30 billable hours in a 40-hour week, utilization is 75%. Report it per person and split delivery from non-delivery roles rather than using one blended agency average, and rely on accurate time tracking.
Most agencies aim to keep 85-90% of clients a year; above 90% is strong, and below 75% signals a delivery problem. An 85-90% retention rate maps to roughly 15-20% annual logo churn for retainer agencies, with top performers at 8-10% and project-based shops running 40%+. Track revenue retention too, not just client count, since a renewed client on a smaller retainer is a hidden loss.
Aim for an LTV:CAC ratio of at least 3:1, ideally 3:1 to 5:1, with acquisition cost paid back in under 12 months (under 6 is excellent). The 3:1 target is a cross-industry services convention, so treat it as directional. Below 2:1 usually means pricing or channel problems, or that CAC is understated because it leaves out selling time and pitch labor.
Use net revenue, also called agency gross income, which is billings minus pass-through costs like media and ad spend and subcontractors. Measuring growth, margin, or average revenue per client on gross billings badly overstates them, especially for PPC and media shops, because a large ad budget inflates the top line without adding any of your own fee income or margin.
Review capacity and cash weekly (utilization, pipeline and win rate, overdue invoices), your core scorecard monthly (revenue and growth, net and delivery margin, churn, MRR, ARPC), and structural metrics quarterly (revenue per employee, LTV:CAC). Pair every dashboard with a short note explaining what changed and what you are doing about it, so the numbers drive action rather than just sitting there.
Delivery margin, or gross margin, is (agency gross income minus direct delivery cost) divided by agency gross income, times 100. Delivery margin measures the profit left after the labor and tools used to deliver the work, before overhead. Delivery margin is arguably the most important agency metric: healthy delivery margins, often 50%+ on the P&L and 70%+ per project, make overall profitability possible, while thin ones quietly erase it.
A metric is any number you can measure; a KPI is a metric tied directly to a business goal or decision, like margin, utilization, or retention. Vanity metrics such as followers, likes, and impressions look impressive but rarely change what you do next. The test: if the number moved, would you act differently? If not, it is not a KPI worth watching.
Revenue per employee is trailing 12-month revenue divided by full-time-equivalent headcount, including the owner. For agencies, roughly $150K to $200K is a healthy range, with specialists reaching more. Revenue per employee flags whether your team is right-sized for the revenue it produces, so recalculate it whenever headcount changes and read it alongside utilization and margin.
Four, and most agencies track twenty and act on none. Utilization, meaning what share of paid hours reach an invoice. Gross margin per client, which is the number that tells you who to fire. Realization, meaning what you billed against what you tracked. And revenue per client, because growth from existing clients costs a fraction of growth from new ones. The marketing agency metrics that look impressive on a dashboard, like impressions delivered or campaigns launched, describe activity rather than whether the agency is making money.
Most of them, if the work is in one place. AgencyKit works out ten of the twelve metrics on this page from the hours, invoices, retainers and pipeline already in the workspace: monthly recurring revenue, revenue growth, average revenue per client, net margin, billable utilization, effective hourly rate, CAC, LTV, LTV to CAC and win rate. Client churn and net revenue retention are not calculated in the product, so those two stay a manual exercise. The profit and loss report is on the Agency plan at $39 a month.
Because each one needs two or three sources to agree. Utilization needs tracked hours and a rate, delivery margin needs those hours and the salary behind them, and LTV to CAC needs the pipeline and the invoices. When proposals, contracts, invoices, hours and the pipeline sit in one workspace the figures reconcile by default, which is the whole reason a monthly spreadsheet chore turns into a dashboard.
Reading this in Google? You can tell it to show AgencyKit to you more often.
Sources & References
- Promethean Research, How Profitable Are Digital Agencies (2025). prometheanresearch.com
- Parakeeto, agency metrics and profitability research (2025). parakeeto.com
- Predictable Profits, 2025 Agency Growth Benchmark, 300+ agencies (2025). predictableprofits.com
- AgencyAnalytics, 2025 Marketing Agency Benchmarks Report (2025). agencyanalytics.com
- The Wow Company, BenchPress agency benchmark survey (2024). thewowcompany.com
- Focus Digital, Average Marketing Agency Churn (2026). focus-digital.co
- Alto Accounting, Client Acquisition Cost, LTV and Payback for Agencies (2025). alto-accounting.com
- AgencyKit reports, P&L, retainers and time tracking (2026). agencykit.tech